Cuprins
- Abstract 2
- 1. INTRODUCTION 4
- 1.1 Objectives. 5
- 1.2 Decisions to be taken 5
- 2. MAIN BODY 6
- 2.1 Analysis methods 6
- 2.2 Data collection method 6
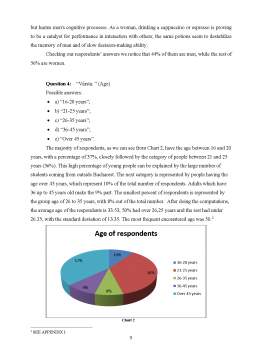
- 2.3 Questionnaires 7
- 2.4 Time and Income correlation 22
- 2.5 Time and Age correlation 22
- 3. CONCLUSIONS 22
- 4. BIBLIOGRAPHY 23
- 5. APPENDIX
Extras din proiect
1. INTRODUCTION
Coffee is universal in its appeal. It has become recognized as a human necessity. It is no longer a luxury or an indulgence; it is a corollary of human energy and human efficiency. People love coffee because of its two-fold effect—the pleasurable sensation and the increased efficiency it produces.
Coffee has an important place in the rational dietary of all the civilized peoples of earth. It is a democratic beverage. Not only is it the drink of fashionable society, but it is also a favorite beverage of the men and women who do the world's work, whether they toil with brain or brawn. It has been acclaimed "the most grateful lubricant known to the human machine," and "the most delightful taste in all nature."
Men and women drink coffee because it adds to their sense of well-being. It not only smells good and tastes good to all mankind, heathen or civilized, but all respond to its wonderful stimulating properties. The chief factors in coffee goodness are the caffeine content and the caffeol. Caffeine supplies the principal stimulant. It increases the capacity for muscular and mental work without harmful reaction. The caffeol supplies the flavor and the aroma—that indescribable Oriental fragrance that woos us through the nostrils, forming one of the principal elements that make up the lure of coffee. There are several other constituents, including certain innocuous so-called caffetannic acids, which, in combination with the caffeol, give the beverage its rare gustatory appeal.
This year, as in the previous year, the specialists expect that the segment of coffee specialties to be the most dynamic. Analyzing the evolution during 2010- 2011, we see that the other two segments, the roast and ground coffee and the soluble coffee registered significant increases.
In Romania it is consumed 2.5 kilograms of coffee per inhabitant, while the European average stands at 5 kg per inhabitant.
The reason we got involved in this statistical analysis of the coffee consumers is to open a café that meets the desires and needs of our prospective clients and also helps us shape an idea about the level of coffee consumption in Bucharest , respectively in Romania.
The goal of the café is to provide a special menu of the highest quality coffee in a cheerful and relaxing atmosphere.
1.1. Objectives:
- Opening a successful café having as main segment the coffee consumers from middle class in Bucharest
- Permanently adaptation in the business environment in Bucharest by offering new products and ways of spending leisure time
- A minimum of 100 clients / day in the first year of business
- Develop a relationship of trust with customers, so promoting the café would be made through recommendations firstly
- To increase the frequency of customers’ visitations.
- To maintain positive sales growth and increase market share
- Increase brand awareness
In order to achieve all these goals, we have thought of going deeper in this analysis, and use not only percents, but also statistical analysis and, also, try to see the preferences of our potential clients as to have the success granted.
1.2 Decision to be taken
Before starting any investigation, a problem has to identified, otherwise, there is no investigation to be made. The problem we identified consists of whether we should go on with our project of opening a new cafeteria, and if yes, what strategy we should apply in terms of prices, target market, location, products offered and so on, in order to attain our objectives regarding this investment.
This study is just a part of the steps we have to follow in order to find out if our idea of opening a cafeteria is viable. In order to assess the answers from our study, we need to interpret and compute central tendency measures: mean mode, median, as well as variances and coefficient of determination. Also, we will have graphical illustrations through pie chart and scattered diagram.
Bibliografie
“Statistics for business administration”, Prof.univ.dr.Constantin MITRUT; Conf.univ.dr.Dana SERBAN; Prep.univ.drd.Cristina Andreea MITRUT
“Statistica afacerilor”, Prof.univ.dr.Alexandru ISAIC-MANIU, Prof.univ.dr.Constantin MITRUT, Prof.univ.dr.Virgil VOINEAGU
http://www.statsoft.com/textbook/basic-statistics/%5c
http://wikipedia.org
http://google.com
Preview document


Conținut arhivă zip
- Pattern of Coffee Consumption.docx
Te-ar putea interesa și

ABSTRACT (ÎN LIMBA ENGLEZĂ) Water is essential for life - not just human life, but all life forms on Earth. We use water for drinking, cooking,...