Extras din referat
The price P of a product is determined by a balance between production at each price (supply S) and the desires of those with purchasing power at each price (demand D). 2, along with a consequent increase in price and quantity Q sold of the product.
Supply and demand is an economic model describing effects on price and quantity in a market. It predicts that in a competitive market, price will function to equalize the quantity demanded by consumers, and the quantity supplied by producers, resulting in an economic equilibrium of price and quantity. The model incorporates other factors changing equilibrium as a shift of demand and/or supply.
Supply schedule
The supply schedule, graphically represented by the supply curve, is most often expressed by the relationship between market price and amount of goods produced. In short-run analysis, where some input variables are fixed, a positive slope can reflect the law of diminishing marginal returns, which states that beyond some level of output, additional units of output require larger amounts of input. In the long-run, where no input variables are fixed, a positively-sloped supply curve can reflect diseconomies of scale.
For a given firm in a perfectly competitive industry, if it is more profitable to produce than to not produce, profit is maximized by producing just enough so that the producer's marginal cost is equal to the market price of the good.
The supply curve of labor is a perfect example of increasing net input(e.g., wages) above a certain point resulting in decreased net output (hours worked).
Occasionally, supply curves bend backwards. A well known example is the backward bending supply curve of labour. Generally, as a worker's wage increases, he is willing to work longer hours, since the higher wages increase the marginal utility of working, and the opportunity cost of not working. But when the wage reaches an extremely high amount, the employee may experience the law of diminishing marginal utility. The large amount of money he is making will make further money of little value to him. Thus, he will work less and less as the wage increases, choosing instead to spend his time in leisure.[1] The backwards-bending supply curve has also been observed in non-labor markets, including the market for oil: after the skyrocketing price of oil caused by the 1973 oil crisis, many oil-exporting countries decreased their production of oil.[2]
The supply curve for public utility production companies is unusual. A large portion of their total costs are in the form of fixed costs. The supply curve for these firms is often constant (shown as a horizontal line).
Another postulated variant of a supply curve is that for child labor. Supply will increase as wages increase, but at a certain point a child's parents will pull the child from the child labor force due to cultural pressures and a desire to concentrate on education[clarification needed]. The supply will not increase as the wage increases, up to a point where the wage is high enough to offset these concerns. For a normal demand curve, this can result in two stable equilibrium points - a high wage and a low wage equilibrium point
Demand schedule
The demand schedule, depicted graphically as the demand curve, represents the amount of goods that buyers are willing and able to purchase at various prices, assuming all other non-price factors remain the same. The demand curve is almost always represented as downwards-sloping, meaning that as price decreases, consumers will buy more of the good.[4]
Just as the supply curves reflect marginal cost curves, demand curves can be described as marginal utility curve
The main determinants of individual demand are: the price of the good, level of income, personal tastes, the population (number of people), the government policies, the price of substitute goods, and the price of complementary goods.
The shape of the aggregate demand curve can be convex or concave, possibly depending on income distribution.
As described above, the demand curve is generally downward sloping. There may be rare examples of goods that have upward sloping demand curves. Two different hypothetical types of goods with upward-sloping demand curves are a Giffen good (an inferior, but staple, good) and a Veblen good (a good made more fashionable by a higher price).
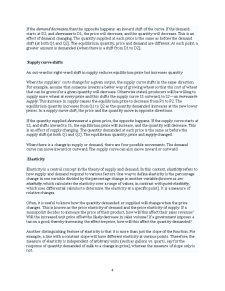
Changes in market equilibrium
Practical uses of supply and demand analysis often center on the different variables that change equilibrium price and quantity, represented as shifts in the respective curves. Comparative statics of such a shift traces the effects from the initial equilibrium to the new equilibrium.
Demand curve shifts
Preview document


Conținut arhivă zip
- Supply and Demand.doc
Te-ar putea interesa și

In economics, supply and demand means the relationship between the quantity that producers wish to sell at various prices and the quantity of a...

History Ancient times Summer developed a large scale economy based on commodity money, while the Babylonians and their neighboring city states...

1. MARKET AREA The market stretches on the geographic territory of Romania, as the following map describes. Geographical Chocolate Consumption...

Introduction Since the emergence of international trade, shipping played a important rol in his development. Currently, over 70% of the volume of...

Aggregate supply and aggregate demand Aggregate Supply Having looked at the components of aggregate demand, we now turn to the supply-side of the...

Supply and Demand: Gas Prices Demand for gas, in the summer of 2005, was bigger than ever. It is well known that when people on vacation use a...

What is Broad Money? At the outset, ‘money’ needs to be defined, and this is traditionally done through its principal function — a medium of...

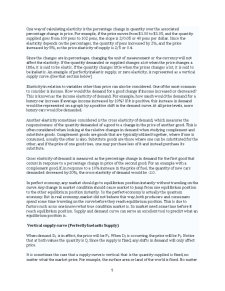
Price Elasticity Introduction Businesses know that they face up with demand curves, but rarely they do know what these curves look like. Yet...