Extras din proiect
Abstract: The innovation process is a complex phenomenon characterized by several stages reaching from basic research up to the penetration of the market with new products. Therefore a whole series of indicators is needed to describe and measure a firm’s innovative activities, each of them stressing specific aspects but also exhibiting measurement errors. Using the information contained in such a system of indicators we have applied the methods of quantitative analysis for characterization of innovative activity. First of all, this method allows to establish on the average how the productive sign changes under the influence of one or several factors, and secondly - quantitatively to estimate narrowness of relationship between variables, i.e. to calculate percent of influence of the concrete factor on the general change of a productive sign. In this work are given examples of the analysis of interrelation of a share of innovative production in total amount of sales of production and the analysis of gain level of profitability of the enterprise.
Keywords: regression, correlation, correlation and regressive analysis, profitability of the enterprise, level of the innovation, level of expenses of R&D.
JEL Classification: C1-3, D0, D8, O3.
INTRODUCTION
The researches based on regression and correlation assumes the use of methods of the description and measurement of statistical relationship.
The concept (definition) of regression and correlation are taken from a biometry and has been offered by Fr. Galton. Originally correlation researches occurred in biology, and later have extended on social and economic area. Simultaneously with correlation the regression has started to be used. Correlation and regression are closely connected among themselves and serve for a parity establishment between the phenomena for definition of presence or absence of relationship.
First of all, this method allows to establish on the average how the productive sign changes under the influence of one or several factors, and secondly - quantitatively to estimate narrowness of relationship between variables, i.e. to calculate percent of influence of the concrete factor on the general change of a productive sign.
The correlation method assumes an estimation of intensity relationship’s force between two or more variables and revelation of concentration’s degree of the fact sheet around regressive lines. The narrowness of relationship is quantitatively expressed by size of correlation’s facts which is also an estimation of the equation’s conformity of regression to the revealed connection of cause and effect.
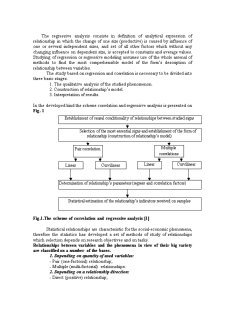
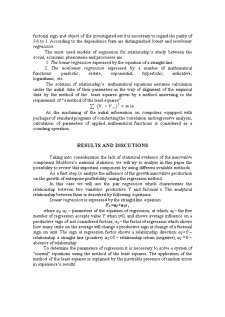
The regressive analysis consists in definition of analytical expression of relationship in which the change of one size (productive) is caused by influence of one or several independent sizes, and set of all other factors which without any changing influence on dependent size, is accepted to constants and average values. Studying of regression or regressive modeling assumes use of the whole arsenal of methods to find the most comprehensible model of the form’s description of relationship between variables.
The study based on regression and correlation is necessary to be divided into three basic stages.
1. The qualitative analysis of the studied phenomenon.
2. Construction of relationship’s model.
3. Interpretation of results.
Preview document


Conținut arhivă zip
- The Possibility of Using Methods of Quantitative Analysis for Characterization of Innovative Activity.doc
Alții au mai descărcat și

ATHOS & FRIENDS BUSINESS PLAN 1. Business Summary 1.1 Business Overview Athos & friends is a canine daycare facility catering to professionals...

1. Introduction For decades, retailers have pursued strategies which are product and transaction oriented. Hence, they focused on the...

Introduction China is believed to have the oldest continuous civilization. China has over 4,000 years of verifiable history. Beijing is the...

Introduction By definition, the term “Climate change” describes any process that alters or modifies the Earth’s weather, including changes in the...

Analiza macro-mediului intreprinderii Studiul macro-mediului intreprinderii permite depasirea orizontului mediului concurential deoarece...

In era globalizarii, specialitii in domeniu vorbesc despre “intreprinderea digitala”, “intreprinderea virtuala” sau “intreprinderea mileniului...

Reforme institutionale si politice in U.E. inaintea procesului de largire. Actuala forma de organizare ce cuprinde 15 tari membre nu mai...