
Extras din proiect
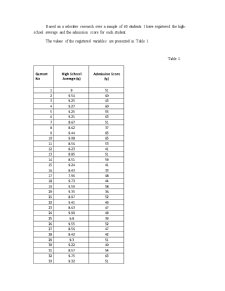
Based on a selective research over a sample of 60 students I have registered the high-school average and the admission score for each student.
The values of the registered variables are presented in Table 1.
Table 1.
Current No High School Average (xi) Admission Score (yi)
1 9 51
2 9.54 60
3 9.25 43
4 9.27 60
5 9.25 55
6 9.21 63
7 8.67 51
8 8.62 37
9 9.44 65
10 9.08 65
11 8.56 53
12 8.23 41
13 8.85 51
14 8.51 59
15 9.24 41
16 8.43 33
17 7.96 48
18 9.73 44
19 9.59 58
20 9.35 36
21 8.97 52
22 9.41 49
23 8.63 47
24 9.99 49
25 6.8 39
26 9.55 52
27 8.56 47
28 8.42 42
29 9.3 51
30 9.22 40
31 8.57 54
32 9.75 63
33 9.32 51
34 8.93 43
35 9.33 46
36 8.91 42
37 9.64 49
38 9.9 56
39 9.47 47
40 9.46 42
41 7.54 39
42 8 46
43 7.4 55
44 8.74 41
45 9.57 45
46 9.27 43
47 8.59 45
48 9.07 55
49 9.19 44
50 8.21 42
51 9.51 57
52 8.95 62
53 9.37 56
54 8.73 42
55 7.72 46
56 9.36 50
57 9.53 62
58 9.76 59
59 8.75 44
60 9.67 46
*Source: Taken from ASE database
1. Compute the average values and of the 60 values
The average HSA mark is:
The average admission score is:
In average each of the 60 students has a high-school average of 8.98 and an admission score of 49.2.
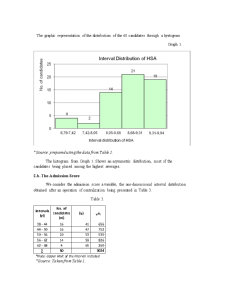
2. Group the 60 values according to each characteristic on 5 equal intervals and present the one-dimensional distributions obatained in the form of tables and statistical graphs
2.a. The HSA mean
We consider the high-school average a variable, the one-dimensional interval distribution obtained after an operation of centralization being presented in Table 2.
Table 2.
Intervals (xi) No. of candidates (ni) (xi) xini
6,79 - 7,42 4 7,105 28,420
7,42 - 8,05 2 7,735 15,470
8,05 - 8,68 14 8,365 117,110
8,68 - 9,31 21 8,995 188,895
9,31 - 9,94 19 9,625 182,875
∑ 60 532,770
*Note: Upper limit of the interval included
*Source: Taken from Table 1.
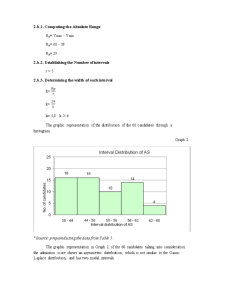
Computing the Absolute Range
Rx= X - X
Rx= 9.99 – 6.8
Rx= 3.19
Establishing the Number of intervals
r = 5
Determining the width of each interval
k=
k=
k= 0,628 k 0,63
Preview document


Conținut arhivă zip
- Proiect Statistica.doc
Te-ar putea interesa și

TEMĂ obligatorie pentru PROIECT individual la STATISTICĂ I. Alegeţi o populaţie statistică formată din minim 40 elemente, la care să înregistraţi...

Capitolul I. Obiectivul proiectului Etimologia termenului “statistica” ne trimite la cuvantul “status”, care ajunge, prin evolutii successive, la...

Obiectiv Cunoaşterea stării economice şi sociale a ţării, a evoluţiei de ansamblu a societăţii româneşti, etapă de etapă, pe parcursul istoriei si...

INTRODUCERE 1. Definirea problemei Colectivitatea cercetată a fost reprezentată de 26 de elevi aflaţi în clasa a XII-a din cadrul unor clase cu...

. Obiectivul urmarit 1.1 Obiectivul statisticii Statistica a aparut din nevoia de a cunoaste intr-o forma masurabila realitatea inconjuratoare si...

S.C. “Helvetica Milk” a luat fiinta în anul 1994 prin asocierea S.C. “Helvetika” S.R.L. cu investitori autohtoni. Asociatii au convenit ca noua...

Observarea statistica presupune respectarea unor principii fundamentale impuse prin lege (Legea nr. 11/1994), principii asemanatoare cu cele impuse...

1. Alegeţi o colectivitate formata din 40 elemente, la care sa înregistraţi date privind 2 caracteristici diferite, dar in strânsa legătura una cu...