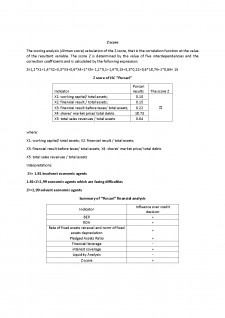
Extras din proiect
Credit Rating of the debtor is performed based on bank’s crediting policy. Each bank has an individual approach for credit scoring, however all of them have some basic financial or nonfinancial indicators to calculate before issuing the credit decision, this indicators are divided in two big groups :
a) Financial Indicators: Are indicators computed on company’s income statement, balance sheet, statement of profit or loss, statement of changes in owner’s equity, general information, other information sources. Examples of financial indicators are: Break-Even-Point, Return on Assets, Return on Equity, Renewal Rate of Fixed assets, Financial Leverage, Liquidity Rc atios.
b) Non-financial indicators: Feedback, creditworthiness, credit history. Source: The Credit Histories Bureau, other financial institutions, suppliers, fiscal authorities, other public authorities.
Our case: At the end of 2016 year, FinComBank JSC received a credit request from “Purcari” JSC in amount of MDL 10 mln for a period of 10 years. The credit destination, as indicated, was the acquirement of new fixed assets that will be used in the production section. In order to issue the credit decision, the bank has to perform the company’s credit scoring based on financial and non-financial analysis.
Financial Analysis:
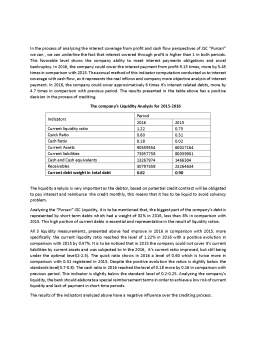
The analysis of company’s Break Even Point Level for 2015-2016
Indicators Period
31.12.2016 31.12.2015
Net Sales 106,760,242.00 71,249,539.00
Cost of Sales 53471103 42460466
Rate of variable costs(%) 68% 63%
Variable costs 36360350.04 26750093.58
Fixed Costs 17110752.96 15710372.42
Contribution Margin ratio(%) 0.659420498 0.624557661
BEP 25948166.62 25154398.71
Analyzing JSK “ Purcari” BEP level in monetary units, we can conclude that the company’s volume of sales exceed consistently the level of BEP, this fact has a positive influence in crediting decision.
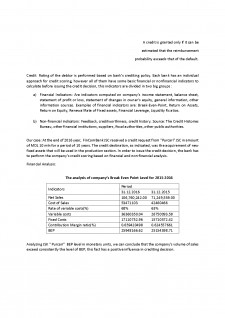
The analysis of company’s Return on Assets for 2015-2016
Indicators Period
01.01.2015 31.12.2015
Net Profit 23,112,387.00 166,209.00
Total Assets 166,956,227.00 140,872,753.00
Owner's Equity 66,390,614.00 45,012,769.00
Return on assets(%) 13.84% 0.12%
Return on equity(%) 34.81% 0.37%
This ratio allows us to identify the company’s performance of own and external financial resources. If this ratio is lower than the effective rate for bank interest, it shows the company’s lack to produce more value than is needed as a result the creditor will deny the credit claim.
Analyzing the dates of JSC “Purcari” presented above, we can conclude that return on assets ration in 2016 reached the level of 13.84%, higher than in 2015 by 13.96% when the this rate stopped at 0.12%. Comparing this result with the potential interest rate for bank loan estimated to be in the interval of 10-12%, we can conclude that this indicators shows the ability to create add value to the company as it’s profitability of assets is higher that the average interest rate by approximatively 2%. When analyzing the return on equity ration, we calculated a 34.81% level for 2015, with an increase in comparison with 2015 by approximatively 21%. This ratio shows that the company is not subjected to disinvestment risk, as the return on equity ratio is much higher that the interest on bank deposits and inflation rate. This indicators have appositive impact on crediting decision.
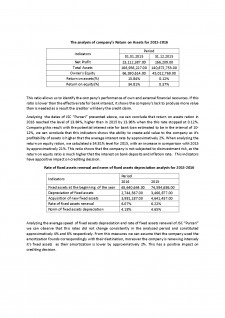
Rate of fixed assets renewal and norm of fixed assets depreciation analysis for 2015-2016
Indicators Period
2016 2015
Fixed assets at the beginning of the year 65,640,644.00 74,594,686.00
Depreciation of fixed assets 2,744,567.00 3,466,877.00
Acquisition of new fixed assets 3,981,187.00 4,641,437.00
Rate of fixed assets renewal 6.07% 6.22%
Norm of fixed assets depreciation 4.18% 4.65%
Analyzing the average speed of fixed assets depreciation and rate of fixed assets renewal of JSC “Purcari” we can observe that this rates did not change consistently in the analyzed period and constituted approximatively 4% and 6% respectively. From this measures we can assume that the company used the amortization founds correspondingly with their destination, moreover the company is renewing intensely it’s fixed assets as their amortization is lower by approximatively 2%. This has a positive impact on crediting decision.
Preview document


Conținut arhivă zip
- Analiza creditibilitatii Holdingului Purcari Wineries in baza indicatorilor financiari.docx
Alții au mai descărcat și

1.SAPARD – prezentare generala, conditii de implemantare a programului Programul SAPARD (Special Accession Programme for Agriculture and Rural...

Mesajul Presedintelui Banca Comerciala Romana încheie anul 2003 cu rezultate financiare pozitive, care ne multumesc si care confirma strategia si...

BANCILE COMERCIALE (DE DEPOZIT) SI ROLUL LOR ÎN SISTEMUL BANCAR Aparitia bancilor moderne este strâns legata de dezvoltarea comertului cu...

1.1. Prezentarea capitolului din acquis-ul comunitar care priveste activitatea financiar bancara: Pentru aderarea la Uniunea Economica si...

OBIECTIVE: Scopul disciplinei consta în asigurarea cunostintelor si informatiilor teoretice, metodologice si operationale în domeniul creditarii...

1. CADRUL LEGAL DE DERULARE A ACTIVITATII BANCARE 1.1. Funcţiile tradiţionale ale băncilor comerciale In cadrul rolului fundamental de...

Accesul la o locatie de memorie se realizeaza prin: a. unitatea aritmetico-logica; b. adresele de memorie; c. adresare de memorie; d. locatii de...

Bancile sunt entitati economice specializate, menite sa infaptuiasca in economie creditarea bancara. In acest fel, ele asigura functionarea deplina...